Author Archive

BY MATT DeFAVERI

Whenever the New York Yankees play their final game of the season this fall, don’t be alarmed by any sudden gale force winds threatening to blow you off your feet. That’s just every batter’s collective sigh of relief at Mariano Rivera’s official retirement from the game.

Rivera’s already cemented his status as a baseball legend, and his performance this season has so far been one for the ages. He’s converted all 18 of his save opportunities, posted a 1.40 ERA and fanned 16 batters in 19.1 innings of work. I still stand by my previous stance on Rivera’s place below Gossage, but no one is doubting that Rivera, 43, is throwing one hell of a good-bye party this year.

As Rivera departs, so does that glorious cutter of his, but will – or can – baseball ever see a cutter as good as Mo’s again?

Back to basics

The motion of throwing a cutter is like turning a doorknob – the index and middle finger sit together, off-center of the ball, and when the wrist snaps down the top two fingers follow in a slightly curved arc. The action creates a spinning motion that, for a right-handed pitcher like Rivera, runs in on left-handed batters and away from right-handed batters.

“The cutter varies per individual quality of the pitch, the comfort level with throwing it and usability,” said Lee MacPhail IV, a major league scout for the Seattle Mariners. “Essentially, as ‘old-time’ baseball people will tell you, it’s actually just a slider. You can use it in a multitude of ways like other pitches in terms of opening up the zone.”

The cutter’s movement is later than a slider, though not quite as abrupt, MacPhail said.

According to FanGraph’s PITCH f/x information, Rivera’s thrown 3,205 cutters since the tool started tracking individual pitches in 2007.

Opposing hitters have a .185 BA against Rivera’s cutter. The pitch produces a ground ball 49.7% of the time and a fly ball 33.2% of the time (not necessarily outs). Rivera’s thrown 2,212 cutters for strikes and just 993 for balls.

By comparison, Boston Red Sox starter Jon Lester has thrown 3,138 cutters since the 2007 season. Opponents hit Lester’s cutter at a .211 clip. His pitch produces a ground ball 49.8% of the time and a fly ball 29.5% of the time. He’s thrown his cutter 2,316 times for strikes and 1,002 times for balls.

Considering Lester’s a starting pitcher, those comps are insane.

One trick pony

Baseball’s a game of adaptation, though Rivera hasn’t exactly conformed to that idea over his career. Over seven seasons, Rivera’s thrown his cutter almost 3 times more than his four-seam or two-seam fastball, yet opponents have steadily hit his cutter less and less over the last three years.

Batters hit Rivera’s cutter at a .214 clip in 2011, a .207 clip in 2012 and a paltry .145 clip so far this season.

Before that, batters had a .250 BA  in 2007, a .183 BA in 2008 and a .158 BA in 2009 against Rivera’s cutter.

The search for the next great cutter might prove fruitful or may lead to disappointment, but MacPhail knows what he’s looking for in the pitch.

“It’s really the lateness in the zone and the action and the deception and the firmness of it, those last 5 feet [to the plate] and ability to deceive the hitter and disrupt his timing,” MacPhail said. “Does the guy have the ability to throw it to both sides? Is it a strike? Is it a quality strike? Is it reliable, dependable?”

Rivera’s cutter has been so effective because hitters can’t time the late movement, said MacPhail, adding, “the deception with the arm path and the delivery and the lateness of the pitch all combine together” to make Rivera’s cutter devastating.

A time for trends

Rivera wasn’t the first pitcher to throw a cutter when he entered the majors in 1995, but the way he threw it was “unique and at a different level,” Macphail said. “He’s a freak of nature. He really is.”

Sometimes certain pitches come in waves, submerging and resurfacing years later. MacPhail pointed to certain trends like Bruce Sutter and Jeff Morris with the forkball.

“This was a short term process, but Bruce had one of the best forkballs I’ve ever seen,” MacPhail said. “[Sutter and Morris] started throwing the forkball and for about 10, 15 years, you didn’t really see many good ones anymore. Hitters laid off of it, they recognize it.”

As for Rivera’s cutter, MacPhail said he’d be hard-pressed to say if baseball would ever see another cutter like it.

“Will we? Could we? Yeah, sure,” he said. “I can’t say it’ll definitely happen, but I’d like to be around to see it. [Rivera’s] unbelievable. He’s a freak. This guy’s probably lived at least three generations beyond the shelf life of most closers. … Whether we’ll ever see another guy like him, it’s hard to say.”

Whatever happens, Rivera’s wheeled and dealed his way to an incredible first two months of his final season in the game. Let’s all enjoy the ride and be thankful for the opportunity to see him pitch one last season.

Comments? Leave them in the comment section below or e-mail the author at mattdefaveri@gmail.com.

BY MATT DeFAVERI

In June, MLB commissioner Bud Selig told USA Today the increase in attendance this year was “breathtaking.”

But with half a month before the 2012 regular season comes to a close, baseball has to draw 3,188,588 more people to equal 2011’s gate of 73,425,667.

Last year’s attendance total is almost quadruple what ball clubs drew in the 1940s and 1950s, but it’s the start of a disturbing trend.

Leaguewide attendance in 2008:
78,624,315

Leaguewide attendance in 2009:
73,430,580

Leaguewide attendance in 2010:
73,061,763

Though attendance ballooned from 2007 to 2008 by about 4 million, MLB will have lost the lion’s share of that once the regular season draws to a close. As of Sept. 13, the sport has drawn  66,237,079 attendees across all 30 stadiums.

This mirrors a similar trend to attendance in the 1960s.

Leaguewide attendance in 1964:
21,280,341

Leaguewide attendance in 1965:
22,441,900

Leaguewide attendance in 1966:
25,182,209

Leaguewide attendance in 1967:
24,308,353

By 1968, ballplayers collectively slumped. The 20-team league collectively hit .237, the lowest league average in baseball history. Teams scored just 3.42 runs per game, the second-lowest total in league history (teams in 1908 scored 3.38 runs per game).

Attendance slumped, too, down to almost 23 million. Games were offensively boring and uninspired. Fans want to see towering home runs, not slow dribblers down the third base line.

23 million is a scary number because 20 years earlier, in 1948, leaguewide attendance was just over 21 million.

Oh, and there were four fewer teams in 1948 than there were in 1968.

Low-scoring games translates into lower attendance. This year, teams are scoring an average of 4.34 runs per game – almost a full run more than in 1968, but not enough to draw enormous crowds, considering the amount of perfect games pitched this season.

There have been 23 perfect games in baseball history. Since the first perfect game was pitched in 1880, six of them – 26% – were pitched in the last 4 seasons.

This year, Chicago White Sox’ Philip Humber, San Francisco Giants’ Matt Cain and Seattle Mariners’ Felix Hernandez slotted their place in baseball lore. Here are the game breakdowns for each pitcher’s perfecto:

Philip Humber

Chicago White Sox
RHP
Final score: CHW 4, SEA 0
Date: April 21, 2012
96 pitches, 9 K
5 groundouts
13 lineouts/flyouts

Career ERA: 4.54
Career Record: 14-14
Career K/9: 6.8s

Matt Cain

San Francisco Giants
RHP
Final score: HOU 0, SF 10
Date: June 13, 2012
125 pitches, 14 K
6 groundouts
7 lineouts/flyouts

Career ERA: 3.29
Career Record: 82-78
Career K/9: 7.5

Felix Hernandez

Seattle Mariners
RHP
Final score: TB 0, SEA 1
Date: August 25, 2012
113 pitches, 12 K
8 groundouts
7 lineout/flyout

Career ERA: 3.14
Career record: 98-72
Career K/9: 8.2

Since 2006, leaguewide batting average and on-base percentage have each steadily declined. The average BA dipped from .269 in 2006 to .255 this season, while OBP went from .337 to .319. That drop can be attributed to some outstanding pitchers emerging, though more stringent steroid testing and less prevalent PED usage have also had significant impacts.

If the league continues at the current rate of declining batting average (0.0023 points a season), teams will hit at that same .237 clip in 1968 by the year 2020. While final attendance numbers are still being tallied, MLB could see attendance plummet by as much as 10-15 million in the next 8 years, even with the addition of a second wild card team.

It’s a scary – perhaps “breathtaking” – proposition.

UPDATE 5/27/2013

Attendance in 2012 totaled 74,859,268 – a solid 1,433,601 increase from 2011’s gate. The totals aren’t quite what they were in 2008, but Selig and the owners will no doubt keep an eye on that total in hopes it’s the start of an upward trend..

Comments? Leave them in the comment section below or e-mail the author at mattdefaveri@gmail.com.

BY MATT DeFAVERI
Brace yourself: Mariano Rivera may not be the greatest closer in history.

In fact, the 42-year-old righty isn’t even the greatest closer on his own team.

The New York Daily News reported two days ago that there still wasn’t a timetable for Mariano Rivera’s return from a torn ACL and meniscus. The Yankee great was injured May 3 shagging fly balls during batting practice before a game against the Kansas City Royals.

It was a tough loss for the Yankees, who have since tagged Rafael Soriano as the closer.

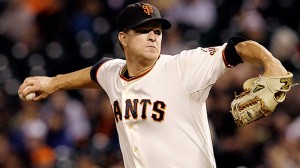
Soriano’s having a very good season, converting all 7 of his save opportunities, posting a 1.89 ERA, and striking out 18 batters in 19 innings.

But if anyone told you five years ago that Rivera’s career would potentially end after a torn ACL and not a shoulder or elbow injury, you’d have looked at them the same way my friends looked at me when I drafted Ryan Howard in the 4th round of my fantasy draft this year.

Barring a return for the 2013 season, which Mo said was a “go,” his injury caps a brilliant career which includes 608 regular season saves (most all-time), 892 games finished (most all-time), 15 consecutive seasons with at least 25 saves and 14 seasons with at least 30 saves.

Rivera may be the best reliever of the modern era, but in a time when pitchers are pampered and throwing more than 75-80 innings of relief in a season is considered “tiring,” the G.O.A.T. title has to go to Rich “Goose” Gossage, who spent six seasons with the New York Yankees from 1978-1983.

CAREER STATS

Goose Gossage
22 seasons
310 saves
681 games finished
1,502 strikeouts
1,809.1 innings pitched
124-107 record

Mariano Rivera
18 seasons
608 saves
892 games finished
1,119 strikeouts
1,219.2 innings pitched
76-58 record

Strong like bull, durable like Nalgene

For all of Rivera’s records, the 12-time All Star only pitched 100+ innings once in his career, logging 107.2 in 1996. The closest he ever came to that was in 2001, hurling 80.2 innings and striking out 83 and posting 50 saves, his second-highest single season total.

As a closer, Gossage pitched more than 133 innings in three different seasons, the last time coming with the 1978 New York Yankees – his first year in pinstripes.

Gossage earned a career-high 33 saves in 1980, compared to Rivera’s career-high 53 in 2004, and while Rivera unequivocally leads the sports in all-time saves, that statistic can be misleading when examining the offenses of the two eras.

The 2004 and the 1980 teams have some similarities, both ranking 3rd in slugging percentage in the majors, 3rd and 4th in OBP and 2nd and 3rd in OPS (on-base percentage plus slugging), respectively.

But offenses in the 80s were more disparate compared to the steroid era of the late 90s and early 2000s.

In 2004, there was an average of 1.12 home runs hit or allowed per game league-wide. In 1980, there were 0.73 home runs hit or allowed per game.

The 2004 clubs averaged 14.74 total bases per game, while the 1980 teams averaged 13.28 bases per game.

The 2004 Yankees led the majors in home runs with 242, while the Arizona Diamondbacks came dead last with 135. But in 1980, the Milwaukee Brewers led the league with 203 dingers (the Yankees were 2nd with 189), while the abysmal New York Mets ranked last with 61. That’s a 136-home run difference between first and last place in 1980, compared to a 107-home run difference in Rivera’s time.

While Rivera is pitching against tougher competition, he’s also the beneficiary of opposing offenses that are more capable of closing the gap and creating that three-run-or-less save situation.

Here’s another telling stat: in 2004, the Boston Red Sox slugged .472 on the way to their first championship in 86 years, while the Brewers only slugged .387 as a team. In 1980, the Brewers led the league with a .448 slugging percentage, while the last-ranked San Diego Padres slugged .342.

That’s an .85 point difference in 2004 compared to a .106 point difference in 1980.

So with less overall offense in Gossage’s era, those offensive rankings become more exaggerated and Gossage found himself in fewer save situations than Rivera. Except for batting average, Gossage’s Yankees were near the top in most major offensive categories in a league that didn’t hit nearly as well as it did during Rivera’s time. Rivera’s going to convert more saves because games in 2004 are closer than they’d be in 1980 due to less disparate offenses.

There’s also a durability question when it comes to Mo and Gossage.

The 1980 Yankees went 103-59 and, backed, by Ron Davis and Gossage, won 77 of 79 games in which they led after 6 innings.

Gossage’s failed experiment (9-17 record, 3.94 ERA) as a starter for the 1976 Chicago White Sox only highlighted his durability. He started 29 times and pitched 15 complete games, collecting 135 K’s in 224 innings of work.

The term “workhorse” comes to mind.

Gossage also logged 53 saves of seven-plus outs in his career. Rivera has only logged one such save.

Gossage pitched an average of 82 innings per season over his 22-year career. Rivera averaged 67 innings per season in his 18-year career.

Rivera doesn’t begin to touch Gossage in terms of durability.

The best offense is a good defense

Except when you also have a good offense. Then just use both.

Rivera is not a strikeout pitcher. He never really has been, even when he broke the single season record for strikeout’s by a reliever in 1996 with 130 K’s in 107.2 innings.

Gossage recorded 130 strikeouts with the 1975 White Sox, but needed 141.2 innings to get it done.

But Gossage’s 1,502 career strikeouts trumps Rivera’s 1,119 total.

Even if we give Rivera another four seasons to match Gossage’s tenure, assuming an average of 62 K’s a season as he has for his career, it would only bump his total up to 1,367. Rivera would need an additional two full seasons to log 1,491 K’s, 11 short of Gossage’s record.

So how can Rivera strike out so many less batters but notch almost twice as many career saves as Gossage?

Short answer: his defense.

Shorter answer: BABIP.

BABIP stands for “batting average on balls in play.” It’s a statistic that measures a defense’s performance converting batted balls into outs.

In other words, it calculates the frequency at which a batter reaches a base after putting the ball in play. For pitchers, it’s a measure of luck, as an extremely high or extremely low BABIP rating should balance out over a period of time.

A low BABIP translates into the defense doing their job and the pitcher getting lucky with where the ball is hit.

In three of Rivera’s more impressive seasons – 1999, 2001 and 2005 – he averaged a .239 BABIP. So when a ball was in play, batters only reached base .239 percent of the time. Those same three seasons, clubs hit at a .266 clip on average.

Gossage’s three best seasons with the Yankees were in 1978, 1980 and 1982, when he posted a .252 BABIP. That number is much closer to the .261 BA that clubs posted on average in those three years.

According to those numbers, Rivera was aided by his fielders more than Gossage. And since Gossage was a strikeout pitcher and Rivera relied more on groundouts from his devastating cutter, Rivera’s defense had to be truly excellent in order to help him record a save.

Gossage earned his saves largely through his own work, pitching more innings and notching more strikeouts than Mo could muster. Maybe Gossage worked harder instead of smarter, but the league in the 80s and the league at the turn of the century were very different from each other.

<insert farm animal joke here>

Author Fran Zimniuch published “Fireman: The Evolution of the Closer in Baseball” in 2010. In the book, Gossage said:

“Don’t tell me [Rivera’s] the best relief pitcher of all-time until he can do the same job I did. He may be the best modern closer, but you have to compare apples to apples. Do what we did.”

Rivera’s a good closer, but there’s no question he leaned on his team on a more frequent basis than Gossage ever did. Gossage stands as the best closer in the history of the sport.

Mo comes in at a close second.

Maybe they should rename the “G.O.A.T.” to the “G.O.O.S.E.”

Posted: May 1, 2012 in Ramblings

He’s a notoriously up and down pitcher. From 2007-2011, Zito posted a 43-61 record, a 4.55 ERA and a 1.40 WHIP. He showed flashes of brilliance in patches during that time, but my guess is he’s due to flounder again sometime soon.

Check out our analysis on Zito and three of the other highest paid lefites in recent memory.

Posted: April 25, 2012 in Ramblings

THE MYTH: Left-handed pitching is worth more than right-handed pitching.

Culminating our three part series on Matt Cain’s six-year, $127.5 million contract – the largest ever for a right-handed pitcher – we’ll examine the salary disparity between righty and lefty pitching and see if Southpaws are actually worth the hefty contracts they command.

The four pitchers we looked at in part 1Josh Beckett, Justin Verlander, Carlos Zambrano and John Lackey – all had average annual salaries ranging from $16 million to $18.3 million.

Collectively, those four righties had an average annual salary of $16.95 million.

The four lefties we’ll look at today – Barry Zito, Cliff Lee, CC Sabathia and Johan Santana – have a combined average annual salary of $21.97 million.

That’s a difference of just over $5 million annually.

So what does that extra $5 million a year buy the Giants, the Phillies, the Yankees and the Mets? Let’s look.

Barbershop quartet

Johan Santana

Latest contract: Six years, $137.5 million
Avg. annual: $22.9 million
Date signed: February 1, 2008
Bad pun: Johan? More like, “No-han.”

Before the contract: 93-44 record, 3.22 ERA, a 1.094 WHIP, 9.5 K/9 ratio, two Cy Young Awards and three All Star appearances over parts of eight seasons.

Yeah, there’s a lot of boldface in there.

After the contract: Santana gets a lot of flak for not pitching up to his contract, but his first two seasons with the Mets were pretty impressive. In 2008, his first season with his new club, he set multiple career records for himself, including lowest season ERA (2.53), most innings pitched (234.1), and most batters faced (964). He started 34 games that year, tied for his previous career high in 2006, and finished third in the Cy Young voting.

The Venezuela native starter had a relatively successful 2009 campaign, going 13-9 with a 3.13 ERA, 7.9 K/9 ratio and a higher-than-average 1.21 WHIP. He was voted to the All-Star team, but only made 25 starts before arthroscopic surgery in his left elbow sidelined the rest of his season. The team placed him on the 15-day disabled list on August 25 that year.

After the surgery, Santana wasn’t quite the same.

He showed flashes of brilliance in 2010 – like his 3-0 record and 0.71 ERA in parts of July – but there were also some stinkers. Namely, the worst start of his MLB career, where he gave up 10 runs in 3 2/3 innings against the Phillies on May 2.

Again, an injury cut his season short when he strained his pectoral muscle September 2 in a game against Atlanta. He had rotator cuff surgery on September 15 and would miss the entire 2011 season.

Through two starts this year, the lefty is 0-2 with a 3.97 ERA, 1.5 WHIP and 13 strikeouts in 11.1 innings.

Cliff Lee

Latest contract: Five years, $120 million
Avg. annual: $24 million
Date signed: December 15, 2010
Bad pun: Now that he wears red and white, everyone should call him Clifford the Big Red Hurler.

Before the contract: Before winning his Cy Young in 2008, Lee actually wasn’t that dominant of a pitcher. In 2004, Lee’s first full season, the Arkansas native went 14-8 but had a horrid 5.43 ERA. He gave up 30 homers that season, 21st most in the majors, and walked 81 batters, tied for 15th with Carlos Zambrano and Barry Zito.

In 2006, Lee’s 1.405 WHIP was 29th worst in the majors. 31st worst? Barry Zito, with a 1.403 WHIP. Lee’s 4.40 ERA betrays his 14-11 record, as he was helped along by a Cleveland offense that was second in the majors in runs scored, fourth in batting average, third in on-base percentage and fourth in slugging percentage.

Lee didn’t really have a breakout season until 2008, when he posted an absurd 22-3 record, 2.54 ERA, 1.4 BB/9 ratio and 1.11 WHIP and won both All Star honors and the Cy.

In 2010, the man gave up 18 walks and 16 home runs with the Mariners and the Rangers. That’s insane.

Save for his two starts against the Giants in the 2010 World Series, Lee was a dominant postseason pitcher with the 2009 Phillies and the 2010 Rangers. He was 7-0 with three complete games, a 1.01 ERA and 67 strikeouts in 64.1 innings. Lee was 0-2 with a 6.94 ERA and a 1.28 WHIP in the aforementioned World Series.

After the contract: Lee’s return trip to the Phillies for more than $30 million less than the Yankees offered him proved a successful venture for him. The big lefty finished 17-8 with a 2.40 ERA, six complete game shutouts and 238 strikeouts in 232.2 innings.

Though he finished third in the Cy voting and earned his third career All Star selection, he disappointed in the NLDS, giving up three runs in six innings of work to the St. Louis Cardinals in his only start. The Cardinals won the best-of-five series, 3-2.

CC Sabathia

Latest contract: Seven years, $161 million
Avg. annual: $23 million
Date signed: December 18, 2008
Bad pun: Everyone knows what “CC” stands for. Cheese curls. Because the man eats a lot of them. What I’m trying to say is, he’s got some girth.

Before the contract: Not lights out, but Sabathia is and will forever remain the penultimate workhorse. Sabathia was second in the 2001 Rookie of the Year voting, but it’s a hard sell to say he deserved that much consideration. His 17-5 record was impressive. His 4.39 ERA and 1.35 WHIP were not.

He also walked the fifth most batters in the majors that year (95) but struck out 171 batters in 180.1 innings, so he was able to limit the damage when batters reached against him.

From 2001-2008, Sabathia went 117-73 with a 3.66 ERA, 1.24 WHIP and 1,393 K’s in 1,659.1 innings. He made three All Star appearances during that time and won the Cy Young Award in 2008.

After the contract: Over the next three seasons, Sabathia pitched an average of 235 innings a season. He posted a 59-23 record, 3.18 ERA and 1.18 WHIP.

He was outstanding in the 2009 postseason, where he went 3-1 with a 1.92 ERA and 32 strikeouts in 36.1 innings, though he lost one World Series start and earned a no decision on the other. The Yankees beat the Phillies in six games to earn their 27th World Series championship trophy.

Barry Zito

Latest contract: 7 years, $126 million
Avg. annual: $18 million
Date signed: December 29, 2006
Biggest qualm: You ruined my perfect quartet of overpaid, pinstriped pitchers, Barry. Thanks a lot.

Before the contract: Zito was a three-time All Star and a 2002 Cy Young Award winner over parts of seven seasons, with a 102-63 record, 3.55 ERA and 1.25 WHIP with the Athletics.

Zito struggled his last three seasons with the A’s to the tune of a 41-34 record, 4.05 ERA and an 8.3 H/9 ratio. The shortest outing of his career came in 2006 against the New York Yankees, when he allowed 7 earned runs in just 1.1 innings.

Despite his difficulties, Zito threw 200 or more innings in each of his six full seasons with the A’s. He never missed a scheduled start and led the American League in starts four times. There’s obvious value in that.

After the contract: There just isn’t much value in a 43-61 record, a 4.55 ERA and a 1.40 WHIP in five seasons with his new club, the Giants. In April 2008, Zito went 0-6 with a 7.53 ERA, becoming just the third pitcher in the last 52 years to go 0-6 before May 1.

His horrible start earned him a demotion to the bullpen, though he returned to the rotation nine days later, on May 7, having never made a relief appearance.

The 2009 season saw a bit of a resurgence in Zito’s performance, though he still posted a losing record (10-13), and a promising start to the 2010 season ended in a disappointing fashion, Zito going 9-14 with a 4.15 ERA.

After an ankle injury cost Zito his spot in the 2011 rotation, the Las Vegas lefty was slotted in a utility role, starting just 9 games and pitching 53.2 innings on the season.

And then, redemption. In his first start this season, Zito pitched a 7-0 complete game shutout against the Rockies. It was his first shutout since 2003.

Some spin wins, some toss losses

Time to look at the four righties we examined two weeks ago and the four lefties we examined today and see how much better the Southpaws actually fare.

THE RIGHTIES (after signing their new contracts)

Seasons pitched: 11
Record: 133-80
Average ERA: 4.02
Innings pitched: 1,871.1
Strikeouts: 1,582
Walks: 647
Hits: 1,743
Complete games: 12
Shutouts: 5
Home runs given up: 179

THE LEFTIES (after signing their new contracts)

Seasons pitched: 13
Record: 161-120
Average compiled ERA: 3.24
Innings pitched: 2,434
Strikeouts: 2008
Walks: 795
Hits: 2,215
Complete games: 23
Shutouts: 13
Home runs given up: 230

THE BOTTOM LINE: The lefties we looked at had 2 more seasons worth of data to draw from, but there are some sizable differences in the numbers.

The lefties won 28 more games than the righties did, and with a $5 million difference in average annual salaries, that’s $20 million spent across four clubs for a collective 28 wins.

That amounts to $714,285 per win.

Our lefties lost 40 more games than our righties did, but pitched 563.2 more innings, racked up 852 more strikeouts, pitched 11 more complete games, 8 more shutouts and posted an ERA 0.78 points below the opposition.

Even with an extra two seasons of data, there’s no way Beckett, Lackey, Zambrano or Verlander make up for those disparate figures.

The win goes to the Southpaws (as if they need another one).

So I guess Matt Cain started off the season pretty well. Initially, anyway.

After signing a six-year, $127.5 million contract with the San Francisco Giants earlier this month, Cain pitched a complete game shutout in a 5-0 win against the Pittsburgh Pirates. He surrendered one hit and struck out 11.

He got knocked around in his second start though, giving up 5 runs on 6 hits in 6 innings of work as the Giants dropped a 7-6 decision to the Arizona Diamondbacks. Two starts does not a season make, but if Cain finds a middle ground, which he’s apt to do, he’ll be the model of consistency the Giants hoped he’d be when they signed him.

Great expectations

Last week, in light of the Cain signing, we looked at some of the biggest contracts handed out to right-handed pitchers and examined their performance before and after their paydays. As one reader pointed out, some of the stats that were brought up – wins, specifically – weren’t the best measure of pitching acumen.

That’s partly correct, considering Zack Greinke and Felix Hernandez have a combined 29-20 record in their Cy Young winning seasons. In 2009, Greinke’s winning year, the anxiety-prone hurler’s .667 (16-8 record) win percentage was 10th-best in majors, but he led with a 9.0 WAR (Wins Above Replacement) and a 2.16 ERA.

In 2010, Hernandez’s winning year, his .520 winning percentage (13-12 record) was 37th best in the majors, but his 2.27 ERA was tops. He also faced 1,001 batters that season, more than any other pitcher and the only one to break the 1,000 mark. Dan Haren was second, facing 994 batters pitching for the Diamondbacks and the Los Angeles Angels.

That Hernandez won as many games as he did was a feat, considering the Seattle Mariners were dead last in the majors in almost every offensive category, including batting average, slugging percentage, on-base percentage, home runs, RBIs, runs scored and total bases.

So win-loss records aren’t the end all be all. But the four pitchers we looked at last week all had solid ERAs to accompany their record.

Zambrano was 59-32 with a 3.14 ERA, Beckett was 41-34 with a 3.46 ERA, Lackey was 102-71 with a 3.81 ERA and Verlander was 65-43 with a 3.92 ERA.

Were some of them helped by an explosive offense and airtight defense? Absolutely. Every pitcher is at some point. Mark Buerhle’s perfect game against the visiting Tampa Bay Rays wasn’t without its incredible defensive plays. But it’s not like Zambrano, Beckett, Lackey or Verlander posted huge win numbers with an ERA over 5.00.

Together, those four pitchers average a $16.95 million annual salary. For a team like the Atlanta Braves, who ranked 15th in the majors last year with an $87 million payroll, $16.95 million would tie up almost 20% of that.

What have you done for me lately?

But the Braves and the Boston Red Sox met the same fate in 2011, losing on the last day of the season and ending their bid for a playoff berth. The Braves spent $39,415,000 on pitching that season.

The Red Sox spent $76,785,333 in that department.

Boston’s three winningest pitchers – Beckett, Lackey and Jon Lester – combined for 40 wins and collectively made $38.7 million.The club paid $967,500 for each of those 40 wins.

Atlanta spent $12.7 million on their three winningest hurlers – Tim Hudson, Jair Jurrjens and Tommy Hanson – and also got 40 wins out of them. They spent $317,500 for each of those 40 wins– a third of what Boston spent.

Boston finished 90-72 last year, while the Braves were 89-73. Same result, similar wins, different payroll.

You’re killin’ me, Smalls

For fans, casual or hardcore, it’s easy to forget that a huge contract isn’t necessarily a smart one, nor is it an indicator of future performance. Clubs obviously spend big money on players based on past performance in hopes that that player continues to shine in the future.

Despite the outcome last season, the Braves spent their money wisely on those 40 wins, though the same can’t be said for some of their other contracts. Derek Lowe definitely didn’t earn his $15 million paycheck, going 9-17 with a 5.05 ERA and a 1.5 WHIP. There’s no “it’s-not-as-bad-as-it-looks” analysis with that one – the man just didn’t pitch well.

Contracts are such a crapshoot that it’s hard to blame Boston for saddling themselves with millions in dead money (Lackey) and underperforming players (Beckett). But certain players, like Verlander, have proven so far that they’re the model of consistency and have earned their big paydays.

And with his record-breaking contract, Matt Cain now has to do the same.

No pressure, big guy.

I promised in my last entry I’d look at huge contracts given to left-handed pitchers this week, but last week’s data needed more analysis. Keep an eye out next week for the lefty portion.

THE MYTH: Big contracts beget stud pitchers.

Alright, maybe it’s not an actual conundrum. But when two-time All Star Matt Cain, the San Francisco Giants’ No. 2 starter, signed a six-year, $127.5 million contract with the club, some were speculating whether Tim Lincecum’s eventual payday could lead to MLB’s first $200 million pitcher.

Cain deserves it. The man’s posted an earth-shattering 69-73 record, an eye-popping 3.35 ERA and an inhuman 7.4 K/BB ratio over parts of 7 seasons – he’s just that dominant.

His closest comps on Baseball Reference are Pascual Perez and Johnny Niggeling.

Pascual Perez and Johnny Niggeling. Let that sink in for a second.

You get the point. Cain’s a talented pitcher in a weaker offensive league with an absurd contract, one that made him the highest paid right-hander in MLB history with $21.25 million average annual salary over the life of the deal. But it’s a contract for an elite pitcher, and Cain is just a very good one. Much better than most pitchers in the game, but not elite.

In anticipation of Cain’s first start of the season against the Arizona Diamondbacks, we’ll take a look at some of baseball’s biggest contracts doled out to right-handed pitchers and see how their new deals affected their performance.

Carlos Zambrano

Latest contract: 5 years, $91.5 million
Avg. annual: $18.3 million
Date signed: August 17, 2007
Little known fact: This is a rare picture of Zambrano actually pitching instead of chucking his glove at a teammate, coach or umpire.

Before the contract: Zambrano broke into the majors in 2001, but didn’t settle into a full season as a starter until 2003, when he went 13-11 with a 3.11 ERA over 214 innings. His strikeouts steadily rose each season and he racked up 168, 188, 202 and 210 K’s from 2003-2006.

Over that time, Zambrano posted a 59-32 record with a 3.14 ERA and 768 K’s in 861 innings. He pitched six complete games and two shutouts and was named to the All Star team in 2004 and 2006 and finished 5th in the Cy Young voting both of those years.

After the contract: Despite ramping up the crazy, Big Z actually had a solid five seasons after signing his new contract. He went 61-39 with a 3.96 ERA, 677 punch outs, 3 complete games and 2 shutouts in 849 innings. He finished 5th in the Cy Young voting again in 2007, was an All Star in 2008 and won two Silver Sluggers in 2008 and 2009. Apparently batting was Big Z’s anger outlet, much like punching a pillow is mine and beer and Popeye’s is Josh Beckett’s.

Josh Beckett

Latest contract: 4 years, $91.5 million
Avg. annual: $17 million
Date signed: April 5, 2010
Little known fact: This is the face Beckett makes when John Lackey tells him, “Sorry Joshie, there’s only dark meat left.” →

Before the contract: Beckett came up with the Florida Marlins (now the Miami Marlins) in 2001. The rough-and-tumble Texan went 41-34 with a 3.46 ERA and earned World Series MVP honors in 2003 before the Marlins shipped him up to Boston – along with Mike Lowell and reliever Guillermo Mota – for stud shortstop Hanley Ramirez.

Beckett broke the 200-inning mark for the first time in his career in 2006, finishing with 204.2 innings pitched. He was a critical player in Boston’s 2007 World Series title, the club’s second in four years. He finished 2nd in the Cy Young voting in 2007 and was named to the All Star team in 2007 and 2009. From 2006-2009, Beckett posted 65 wins, a 4.05 ERA and 723 strikeouts in 792 innings.

After the contract: A back injury ended Beckett’s 2010 campaign early, the righty going 6-6 with a 5.78 ERA over just 127.2 innings. Until last September’s chicken and beer scandal, Beckett redeemed himself with an impressive 2011 season with a 13-7 record, 2.89 ERA and 1.02 WHIP in 193 innings. He lost three of his four September starts in an epic collapse that saw the Red Sox bounced from the postseason on the final game against the Baltimore Orioles on September 25.

Beckett’s first start in 2012 was abysmal. The big lug gave up 7 runs and 5 dingers in 4.2 innings of work as the Sox dropped a 10-0 decision to the Tigers.


John Lackey

Latest contract: 5 years, $82.5 million
Avg. annual: $16.5 million
Date signed: December 16, 2009
Little known fact: Et tu, Lackey? Oh never mind, John. You probably wouldn’t get the reference.

Before the contract: 2002 World Series champion, 2007 All Star and ERA leader and the Angels’ ace for seven years, Lackey was a bulldog on the mound.

In eight seasons with the Angels, Lackey went 102-71 with a 3.81 ERA, 1,201 K’s and a 1.30 WHIP in 1,501 innings of work. He gave up just 151 home runs in that span and pitched 14 complete games and 8 shutouts.

After the contract: Whether it was the pressure felt by a rabid fan base in a big market or simple wear-and-tear over the years, Lackey’s performance dropped off when he arrived in Boston in 2010.

He went 26-23, posted a 5.26 ERA and a 1.50 WHIP from 2010-2011 before Tommy John surgery sidelined his 2012 season. Lackey routinely refused to take responsibility for a bad outing, and most press conferences went like this:

Reporter: John, you gave up sixteen runs over two innings of work. It’s being heralded as two of the worst innings of baseball you’ve ever pitched in your entire career. How do you respond to that?

John: Felt pretty good physically today. Left a couple balls over the plate, made a mistake here and there. You can always pitch worse than you did after a start. I could have given up…I don’t know, eighteen runs in an inning and a third of work.

Reporter: Why were you yelling at Tito for yanking you to start the third? Couldn’t you tell how ineffectively you were pitching?

John: Arm felt real good, thought I had some good life on my fastball. You always want to give your team a chance to win. I wanted to do that. Just trying to go out there and compete, every day.

Oh, John.

Justin Verlander

Latest contract: 5 years, $80 million
Avg. annual: $16 million
Date signed: February 4, 2010
Little known fact: Justin Verlander and Will Smith’s character in I, Robot have something in common: they both have a freakish, bionic arm. The only difference is Smith’s left arm is robotic in the movie.

Before the contract: Total workhorse and stud pitcher. From 2005-2009, the big guy pitched to the tune of a 65-43 record and a 3.92 ERA, along with 6 complete games, 3 shutouts and 746 K’s in 840 innings. Oh, and only 80 homers served up in that time span.

He earned Rookie of the Year honors in 2006, was named to the All Star team in 2007 and 2009 and finished 5th and 3rd in the Cy Young voting for both seasons respectively.

After the contract: After going 18-9 with a 3.37 ERA and 1.16 WHIP in 224 innings in 2010, he improved vastly during his 2011 campaign.

Verlander won the pitching Triple Crown (leading the majors with a 24-5 record, 2.40 ERA and 250 strikeouts) last season and won the Cy Young award unanimously, while also earning MVP honors for his performance.

His 0.92 WHIP and 6.2 hits per 9 innings were the lowest of his career, and joins an impressive list of pitchers who won both awards in the same season, including Brooklyn’s Don Newcombe (1956), Los Angeles’ Sandy Koufax (1963), St. Louis’ Bob Gibson and Detroit’s Denny McLain (1968), Oakland’s Vida Blue (1971), Milwaukee’s Rollie Fingers (1981) and Detroit’s Willie Hernandez (1984).

Still a workhorse. Still a stud pitcher.

THE BOTTOM LINE: Whether Cain lives up to his contract remains a mystery, and one bad start this afternoon against Arizona won’t mean much.

Some pitchers, like Verlander, have lived up to their big contracts, while others – like Beckett and Lackey – have some ground to make up.

Look for ‘The Matt Cain Conundrum, part 2′ next week, as we examine some of the top lefthanded pitching contracts handed out over the years. Those Southpaws command a pretty penny, and more often than not, teams are willing to pay. Unfortunately.

Here’s lookin’ at you, Johan Santana.

If you listened to any Pittsburgh Pirates broadcast in the last twenty years, you probably heard the phrase “the Mendoza line” in reference to a slugger with a wicked case of the Mondays every at-bat.

That “line” is drawn at the .200 batting average mark, so a player hitting below .200 during the season or over the course of his career is said to be under the Mendoza line. Tracking this serves two purposes:

  1. Fans can easily identify which player to throw stuff at.
  2. Without ducking, players generally avoid most items thrown at them because they are, literally and figuratively, slumping.

It’s also a measure of offensive aptitude, says baseball historian David Neft:

“What the significance of it is … if you are a terrific defensive shortstop, you can play regularly in the major leagues with a low batting average. But there’s a limit to how low the batting average can get without losing the job.  You can be Mark Belanger (.228 career batting average), who could keep his job for years at that level.  But at .195, he somehow would’ve broken the barrier and he would’ve lost his job.”

So from this, we can assume that Mario Mendoza, the guy the Mendoza line was named for, probably couldn’t figure out which end of the pine to swing, much less make a flip to second base without tripping over his own two cleats.

Not quite.

Mendoza was a brilliant defensive shortstop who spent parts of his seven seasons with the Pittsburgh Pirates, Seattle Mariners and Texas Rangers from 1974-1982.

Even though the Mendoza line is commonly accepted as .200, Mendoza himself had a lifetime .215 batting average. He flirted with a .200 average though, hitting .198 in 1977 with the Pirates and again in 1979 with the Mariners.

Mendoza explained the term’s origin in an interview with the St. Louis Post-Dispatch in July 2010:

“My teammates Tom Paciorek and Bruce Bochte used it to make fun of me. Then they were giving George Brett a hard time because he had a slow start that year, so they told him, ‘Hey, man, you’re going to sink down below the Mendoza Line if you’re not careful.’ And then Brett mentioned it to Chris Berman from ESPN, and eventually it spread and became a part of the game.”

The Mendoza myth was forever memorialized once it entered mainstream media.

“Nobody would remember Mario Mendoza if not for that,” Neft says. “This happens in sports and in baseball. There’s no question that Tinker, Evers and Chance are better known and thought to be better ball players than they actually were. There is this media thing of sports when something becomes well known and something becomes very popular.

“So the Mendoza line becomes something that people associate with low hitting infielders. It has nothing to do anymore really with Mario Mendoza.”

Oh. So I just wasted all this time proving Mendoza was a more productive out hitter than Brett or Bochte? Fine, guess I’ll just scrap it.

…Naw.

Sticks and stones

Brett and Bochte really didn’t have room to talk when it came to ragging on Mendoza. Despite his low batting average, Mendoza made sure his outs counted. As Neft points out, Mendoza would’ve been asked to sac bunt more often than Brett or Bochte, but the sample size for each player across four seasons is telling.

Elias Sports Bureau lists the criteria for a productive out as follows:

  • A successful sacrifice for a pitcher with one out.
  • Advancing any runner with no one out.
  • Driving in a baserunner with the second out of the inning.

Here’s the breakdown of the seasons where Bochte, Brett and Mendoza each had at least 21 opportunities to record a productive out.

1974
Bochte: 11-21
Brett: 17-48
Mendoza: 9-25

1979
Bochte: 23-59
Brett: 25-63
Mendoza: 19-48

1980
Bochte: 18-42
Brett: 18-34
Mendoza: 15-28

1981
Bochte: 8-23
Brett: 10-21
Mendoza: 18-35

Here are those numbers aggregated:

Bochte – 60-145, or 41%
Brett – 70-166, or 42%
Mendoza – 61-136, or 44%

Granted, Bochte’s .282 career average and Brett’s prestigious membership to the 3,000 hits, 300 home runs, and career .300+ batting average club trump Mendoza’s ability as a productive out hitter, but it’s a small victory for the offensively-challenged shortstop. Mendoza’s real value was his career .960 fielding percentage, good for 146th all-time among shortstops.

Does it vindicate Mendoza as a poor offensive infielder? Definitely not. There were plenty of seasons where Mendoza had just four or five opportunities at the plate to make a productive out, but the numbers make it interesting to explore.

A numbers game

So Mendoza gets a bad rap as an offensive player and the casual fan doesn’t bother to research his defensive ability (or desperately prove he had some plate prowess).

Fans nearly riot when their star player strokes two home runs in the first month of play or their ace pitcher sports a 6.45 ERA through two games. They call for the skipper’s head after a 3-5 record to open the season and demand cleaning house and starting from square one.

Tabula rasa.

This trend isn’t new, Neft says.

“It’s always been happening, it’s always been manifesting in the same way,” he says. “There are more things for people to look at and talk about, more ways to second guess the manager and the general manager. But that’s their sport. If you’re not on the field, you have that chance to be an armchair general manager or an armchair manager.”

The beauty of baseball numbers is they become significant only when a large enough sample size exists, Neft says.

“I really never pay any attention to a player’s stats until a third of the way through the season because they don’t mean a great deal. Similarly, when somebody says, ‘Oh, this guy is a terrific hitter against this pitcher, he’s .400 against him.’ Well, he could be 4/10 against him, it doesn’t mean anything.”

Universally, across every sport, fans are optimists. Choruses of “this year’s gonna be the year” ring throughout the offseason in Cleveland and Pittsburgh, and teams do occasionally surprise fans by playing above their expectations. But naturally, some teams play worse than they’re expected to.

“That’s part of the fun. It’s part of rooting for a team. … If that didn’t happen, you wouldn’t have to play the games. You could anoint the champion on Opening Day.”

But that wouldn’t be any fun. Unless you’re a Cubs fan. Then you can just watch this commercial over and over and cry into your pint of Haagen Daas: